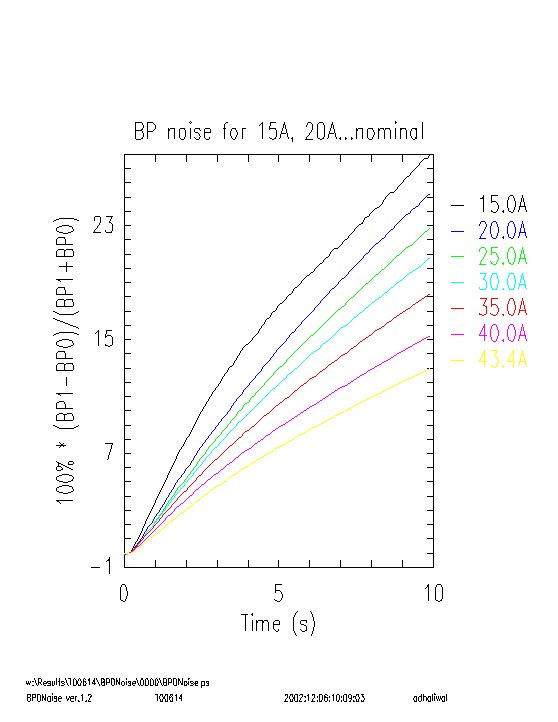
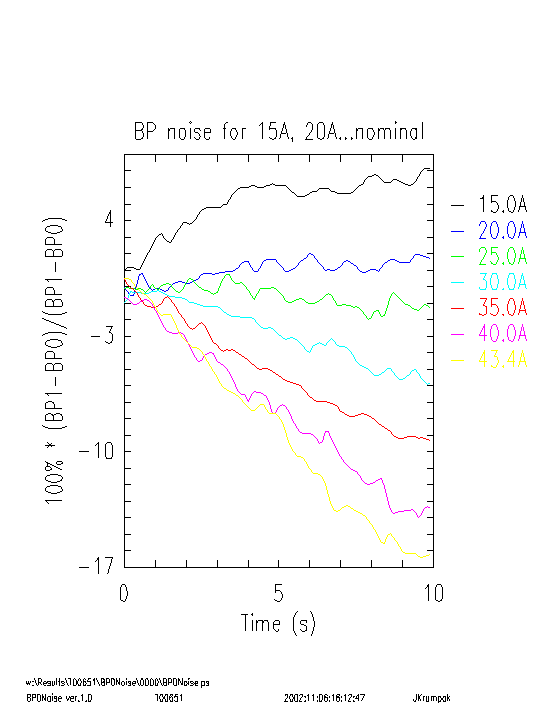
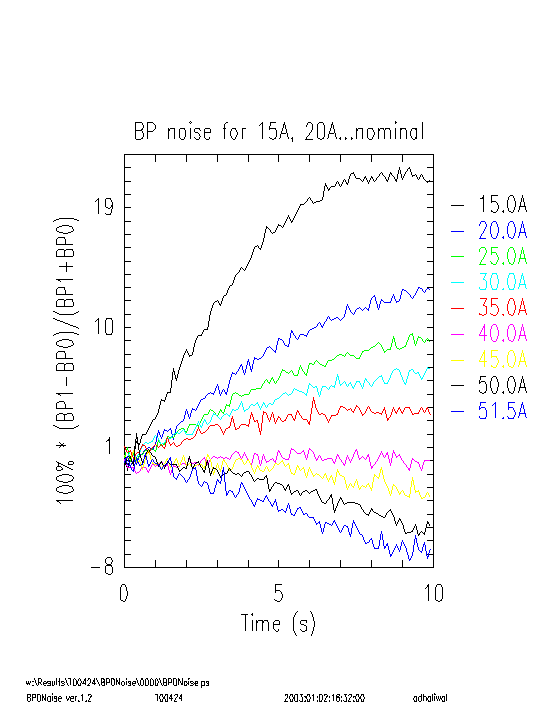
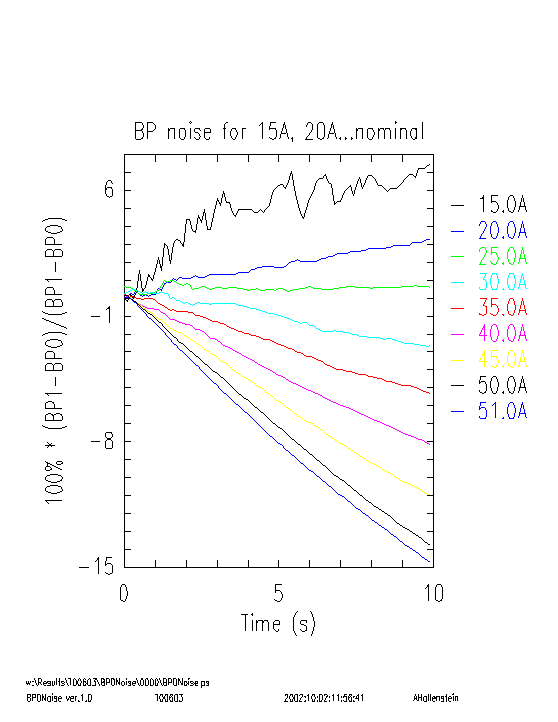
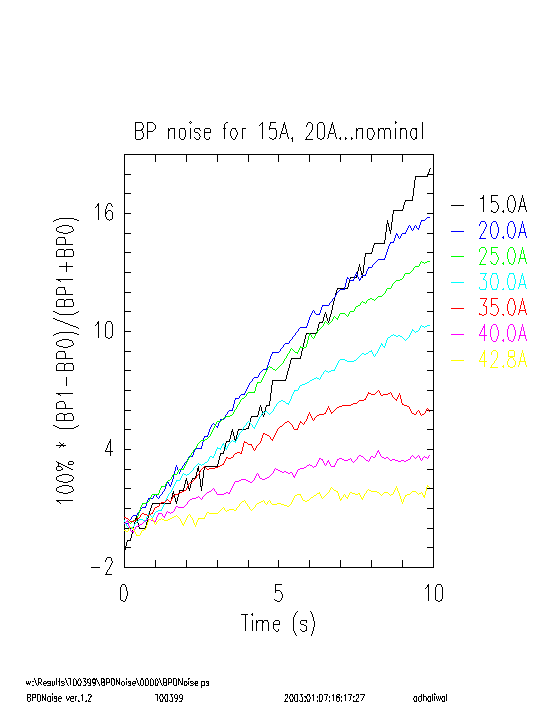
BPDNoise.spt is used to measure the noise on the beam pointing (BP) sensor. If the noise is too high, then the BP servo will not position the beam accurately enough. This script is supplied by the Thermal II group.
When the BP servo is tuned using BPDSettle.spt, the BP sensor error signal must be stable to less than +/-0.5%. If you are having trouble tuning the gains, it is possible that the sensor noise is too large.
BPDNoise.spt will test the BP sensor noise at various laser currents, from 15A up to nominal laser current, and display the results in the BPDNoise graph file. The graphs axes are percent BP sensor error versus time. At each chosen write laser current, the script turns on the BP servo, lets the servo settle and then waits for a few additional seconds. The servo is then turned off at the time corresponding to 0s on the graph. Any noise at this point will be due to noise in the system, rather than servo setup problems. The BP error signal will drift after the servo is turned off. This drift in the error can be either increasing or decreasing, but it must be smooth. Any noise in the system will be indicated by ripple superimposed on the drift. The y axis will always have 1% divisions, so that it is easy to tell when the noise exceed 0.5% (the point at which there will be problems successfully tuning the BP gains).
The raw data can be found in the BPDNoise_data.txt file. The organization of this file is discussed below.
If the output graph shows unacceptable noise and you are in production, call a production engineer for advice.
If you are at a customer site, and there are no plot artifacts, record that you made this observation, as this may make future debugging easier. If there are plot artifacts, please call the response center for advice.
Organization of BPDNoise_data.txt:
The first five elements of the first row of the data file contains the BPD NVS data: Kp, Ki, Kd, BeamPosition, and HoldCurrent, respectively.
The remaining rows contain the gathered data. The first column contains the time in seconds. The second through final column contains the data for the increasing currents.