

Home | Contact Us | Submit Troubleshooting Info | Search | Help
Output | Software Solutions | Proofing | Color, Screening and Calibration | Scanning | Digital Photography | Consumables | POS
Home | Contact Us | Submit Troubleshooting Info | Search | Help
Output | Software Solutions | Proofing | Color, Screening and Calibration | Scanning | Digital Photography | Consumables | POS
Dolev 800 - Brisque Application Issues
Class Screening
Film LUT's
Film Rep Curve
Overview
Creating a Film Rep Curve LUT
In Film Reproduction, you type in a previously prepared two-column table of values. One column of values represents the dot percents in the image file and the other column represents the dot percents that are required on film in order to achieve the desired results on paper.
A Film Rep (Reproduction ) Curve enables you to control the density that is output on paper. It compensates for non-linearities between density on film and density on paper.
Due to varying film and developing parameters, such as: film type and processing chemicals, the output density of the exposed fim usually differs from the density specified in the image file. The Excurve Table solves this problem.
To create an Excurve Table, you measure and then type in the output densities on film that result from the densities in the image file. From this information, the system creates an opposite curve which you apply during exposure.
The linearity acheived by the Excurve Table between file image densities on film that result from the densities in the image file. From this information, the system creates an opposite curve which you apply during exposure.
The linearity achieved by the Excurve Table, you measure and then type in the output densities on film that result from the densities in the image file. From this information, the system creates an opposite curve which you apply during exposure.
The linearity achieved by the Excurve Table between file image density and flm image density is not enough. The main objective is not quality film output but quality output on the final printed sheet.There are two issues that must be handled to achieve this objective:
For Example: When you expose a strips image using an Excurve Table, the result should be an exact match between densities in the image file and those output on film.
However, after a sheet of paper is created from this film, the results on paper may not be those that you require.
| A | B | C |
| Density in Image File = Density on Film | Density Measured on paper | Density Required on Paper |
| 0 | 0 | 0 |
| 5 | 11 | 9 |
| 10 | 18 | 17 |
| 20 | 36 | 33 |
| 30 | 52 | 47 |
| 40 | 65 | 59 |
| 50 | 78 | 70 |
| 60 | 82 | 79 |
| 70 | 90 | 86 |
| 80 | 95 | 92 |
| 90 | 98 | 96 |
| 95 | 100 | 98 |
| 100 | 100 | 100 |
As you can see, the density measured on paper (column B) does not match the density requred on paper (column C).
Note: Column c values are purposely different from column A values because of photographic considerations.
The Film Rep automatically produces the required density values on paper (column C) when you expose the image file/ film density values (column A).
The graph below illustrates the values in the previous table. The values in the X axis are the initial values you entered. The values in the Y axis are the values obtained.
Graph
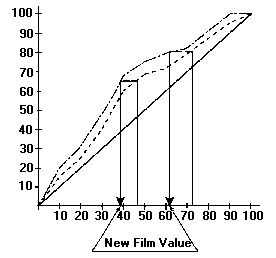
For example, the required value is 65. The entered value is 47 and the value obtained is 73.
According to the graph, the new value you need to enter in order to obtain 65 (on paper) is 38 (on film).
To calculate the correction values for the film, measure at least 11 points.
To prepare the required LUT, use "Dot Gain LUT."
With "Film Reproduction," you manually type in a previously prepared table of values. These values represent the densities in the image file and their required densities on film.
The system creates an opposite curve, based on the Film Rep which you apply during exposure.
Important Note: The following method applies to positive film only.
To type in a previously prepared Film Rep Curve, perform the following:
Graph
The Dot Gain table that you have created is listed in the Library list as type "DOT."