

Home | Contact Us | Submit Troubleshooting Info | Search | Help
Output | Software Solutions | Proofing | Color, Screening and Calibration | Scanning | Digital Photography | Consumables | POS
Home | Contact Us | Submit Troubleshooting Info | Search | Help
Output | Software Solutions | Proofing | Color, Screening and Calibration | Scanning | Digital Photography | Consumables | POS
Installation
Figure 45. shows the CreoScitex Digital Target (SDT) after positive exposure on a negative plate (the SDT after positive exposure is similar). The numbers in below text refer to the numbers in figure.
Figure 45. shows the SDT after positive exposure on a negative plate.
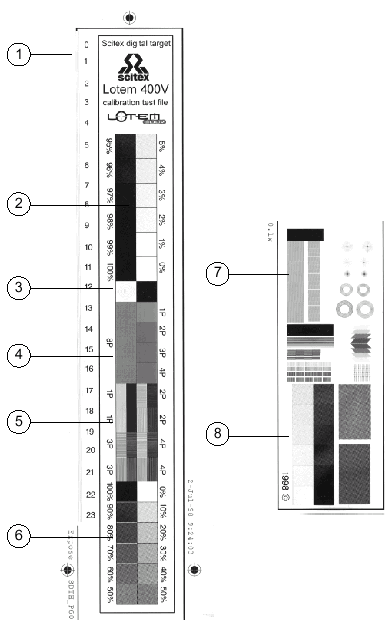
Figure 45. SDT after positive exposure on a
negative plate