Home | Contact Us | Submit Troubleshooting Info | Search | Help
Output | Software Solutions | Proofing | Color, Screening and Calibration | Scanning | Digital Photography | Consumables | POS
Home | Contact Us | Submit Troubleshooting Info | Search | Help
Output | Software Solutions | Proofing | Color, Screening and Calibration | Scanning | Digital Photography | Consumables | POS
Description | Graphs | Data | Data Interpretation
This script graphs the focus laser power versus current, and it is used to check for focus laser diode damage or failure. A PI graph is provided to help in the interpretation.
Use this script in the case of focus laser errors or imaging issues.
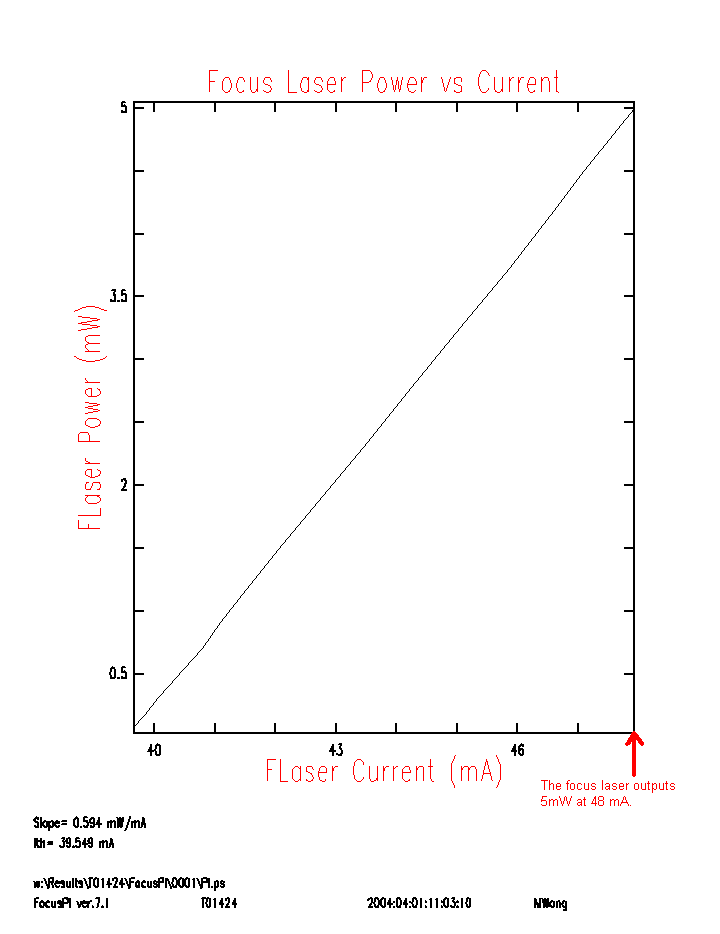
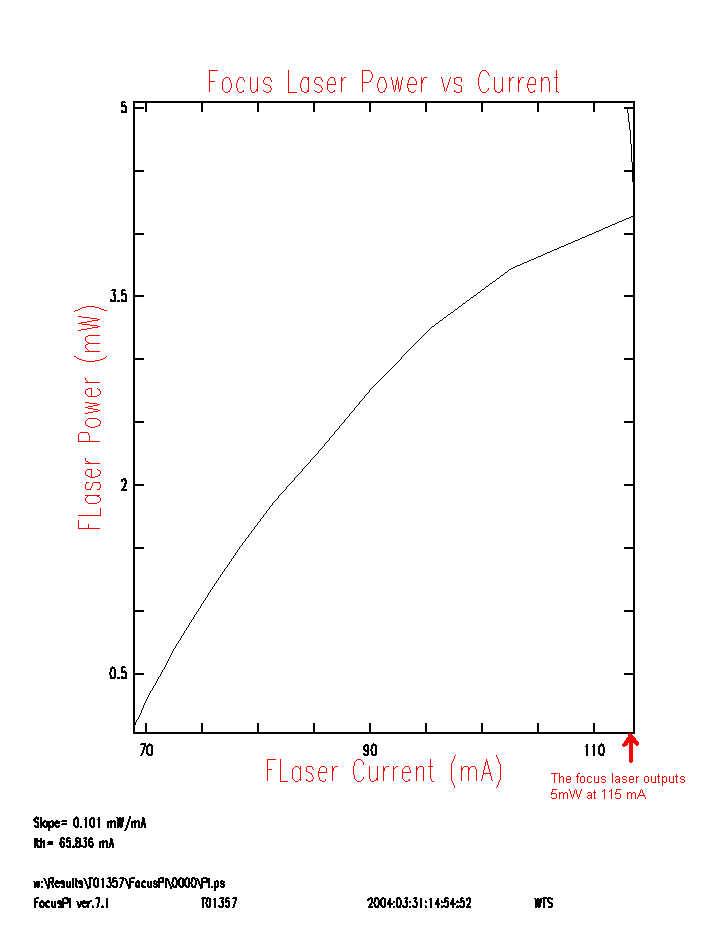
PI.ps: This graph shows focus laser power versus focus laser current.
There is one output file, FocusPI_data.txt. This file contains four columns:
The PI graph should roughly be a straight line. It may deviate slightly from a straight line due to random measurement error. If the line is strongly curved or has a gross "stairstep" appearance, particularly at the high current end of the line, then the focus laser may be damaged.
The maximum focus laser current should not exceed 100 mA and rarely exceeds 60 mA. If the focus laser current exceeds 100mA at any point in the graph, the focus laser is damaged and the head needs to be replacement.