Home | Contact Us | Submit Troubleshooting Info | Search | Help
Output | Software Solutions | Proofing | Color, Screening and Calibration | Scanning | Digital Photography | Consumables | POS
Home | Contact Us | Submit Troubleshooting Info | Search | Help
Output | Software Solutions | Proofing | Color, Screening and Calibration | Scanning | Digital Photography | Consumables | POS
Whisper-SCINET (PTOP)
|
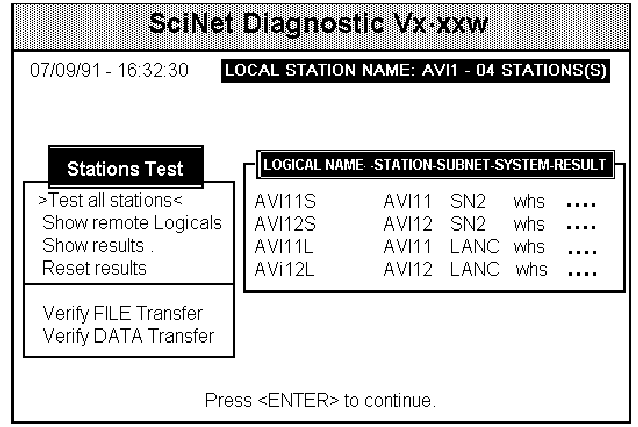
| Test All Stations | This test checks the communication and configuration between the local station and each individual station on the Logical Name list, one by one. The result of the test appears in the "result" column of the list. |
| Show Remote Logicals |
The
cursor will move over to the "stations
list" window. Using the UP and DOWN ARROW
keys, select the station you wish to test. The
system reads that remote station's configuration
and displays it, overwriting the "station
list" window. (Note: This remote list does
not have the "result" column.) The new window contains the list, by logical name, of all stations configured on the selected remote station. |
| Show Results | The cursor will move over to the "stations list" window. Using the UP and DOWN ARROW keys, select the station whose "result code" you wish to see. The result code was previously determined after one of the two options above were invoked. A PASS result indicates that communication was successful. A FAIL code interpretation is displayed at the bottom of the screen. |
| Reset Results | After communications is attempted, the result field is set. To clear the Result field for all stations in the list, select this option. The field will then contain dots ( ...... ). |
| Verify FILE Transfer |
The
cursor will move over to the 'stations list"
window. Using the UP and DOWN ARROW keys, select
the station you wish to test. Then press
<ENTER> to verify successful file transfer
to the highlighted station. The local station transmits a one megabyte random data file to the selected remote station. After an entire file is transmitted, the local station reads both local and remote files and then compares them. |
| Verify DATA Transfer |
The
cursor will move over to the "stations
list" window. Using the UP and DOWN ARROW
keys, select the station you wish to test. Then
press <ENTER> to verify successful data
transfer to the highlighted station. The local station transmits one megabyte of random data to the selected remote station. Each transmitted block will be echoed by the remote station, and the data will then be verified by the local station. |
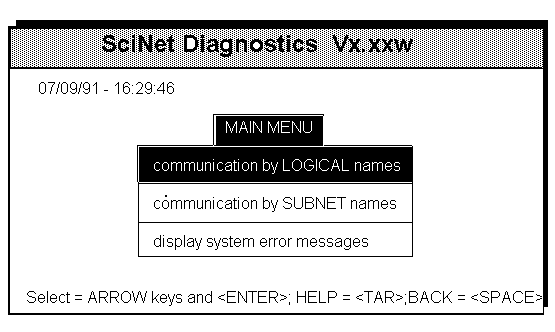
After selecting the Communication by SUBNET Names option from the intial SciNet Diagnostics screen, a list of subnet names, on which this local station is configured, is displayed.
SciNet
Diag. by Subnet Names
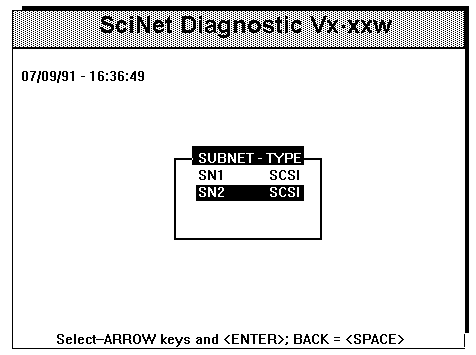
After selecting the subnet you wish to test, the main screen is displayed with a list of stations belonging to that subnet in the "stations list" window. Note that the list of stations is the same as was configured in the Subnetwork Configuration screen during system configuration. This option allows the testing of communications between this local station and each station which appears on the list. Each station contains the following information:
Station Name, System Type, Station Type, Link Type, Result Code
A menu with all the possible testing functions appears in the "stations test" window. When the cursor appears in this window, select one of the six possible options.
SciNet
Diagnostics by Subnet Name
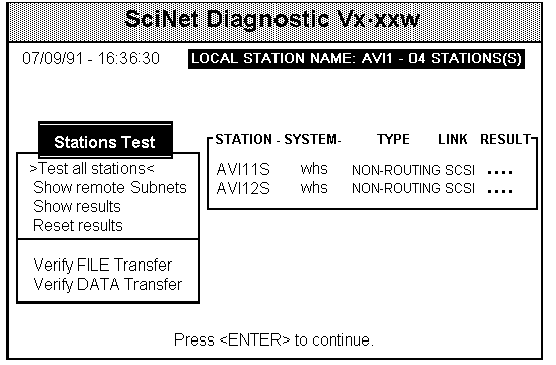
| Test All Stations | This test checks the communication between the local station and each individual station in the "stations list" window, one by one. The result of the test appears in the "result" column of the list. |
| Show Remote Subnets | The
cursor will move over to the "stations
list" window. Using the UP and DOWN ARROW
keys, select the station you wish to test. The
system reads that remote station's configuration
and displays a list of subnets defined on the
remote station. Select the remote station's subnet you wish to view. The remote station's configuration for that subnet is displayed in a new list over the existing "station list" window. (Note: This remote list does not have a "result" column.) |
| Show Results | The cursor will move over to the "stations list" window. Using the UP and DOWN ARROW keys, select the station whose "result code" you wish to see. The result code was previously determined after one of the two options above were invoked. A PASS result indicates that communication was successful. A FAIL code interpretation is displayed in the "message" window at the bottom of the screen. |
| Reset Results | After communications is attempted, the result field is set. To clear the Result field for all stations in the list, select this option. The field will then contain dots ( ...... ). |
| Verify FILE Transfer | The
cursor will move over to the 'stations list"
window. Using the UP and DOWN ARROW keys, select
the station you wish to test. Then press
<ENTER> to verify successful file transfer
to the highlighted station. The local station transmits a one megabyte random data file to the selected remote station. After an entire file is transmitted, the local station reads both local and remote files and then compares them. |
| Verify DATA Transfer | The
cursor will move over to the "stations
list" window. Using the UP and DOWN ARROW
keys, select the station you wish to test. Then
press <ENTER> to verify successful data
transfer to the highlighted station. The local station transmits one megabyte of random data to the selected remote station. Each transmitted block will be echoed by the remote station, and the data will then be verified by the local station. |
The SciRing Diagnostics program tests the communication between all stations (Scitex and non-Scitex) on the FDDI token ring network. SciRing is able to display information regarding the connection status, address, logical name and statistics of every station in the ring.
Invoking SciRing
SciRing is invoked
through the Diagnostics Handler.
To start Diagnostics from the application:
Select SERVICES from the system menu displayed horizontally at the top of the screen.
Select
DIAGNOSTICS from the Services menu. The
application will then boot the Diagnostic Handler
and the Startup screen will be displayed.
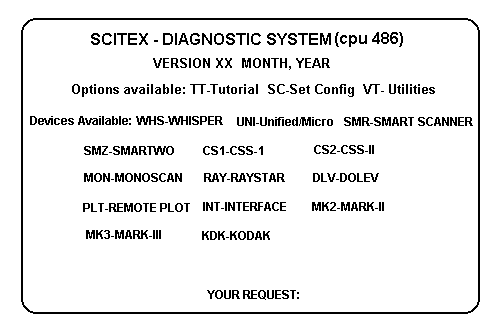
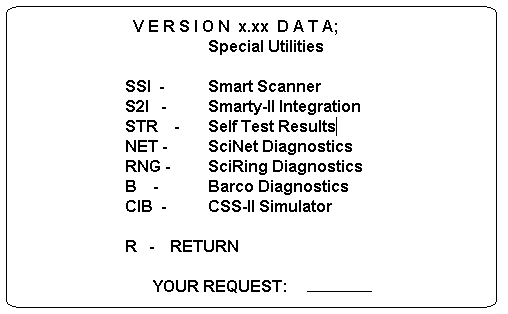
At the Diagnostics Startup screen, SciRing is
accessed via the UTILITIES option. Enter
"UT" and then "RNG".
NOTE: You may start SciRing without the
Diagnostics Screen. At the RMX prompt enter:
AF /PRISMA/DIAG
SCIRING
Keyboard Conventions
| <UP>, <DOWN> arrow keys | Highlight an item on the list. |
| <ENTER> key | Select the highlighted item. |
| <SPACE> bar | Go back to the previous option. |
| <TAB> key | Help message is displayed (if available). |
Main Menu Options
Upon invoking SciRing, the FDDI software is loaded and there is a delay of 30 seconds to allow the ring to stabilize. At this point the main menu is displayed. A log file is automatically opened which keeps an audit trail of the low level program I/O information. This may be viewed later for network analysis.
The main options are as follows:
SciRing
Diagnostics Screen:
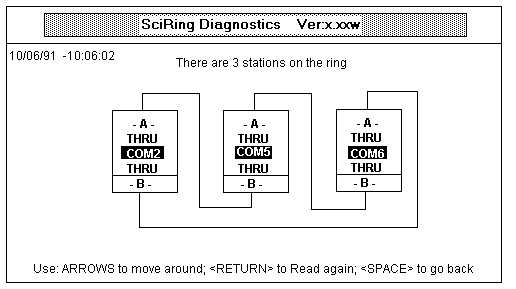
This selection scans all the stations on the FDDI ring every 60 seconds and graphically depicts the connection status onto the screen.
Each square on the screen represents a station. The text highlighted in the square is the station name. One of four status conditions may exist:
| THRU | Indicates a normal connection from this station's port to the neighboring station ("A" to "B"). |
| WRAP | Indicates the port that is acting as primary receiver and transmitter to the neighboring station. |
| N.C. | Not Connected. Indicates a problem with the fiber optic cable or connector. No connection is sensed. |
| TWISTED | If this condition flashes on the screen, it indicates that the connections to the bypass box were incorrect. |
Additional Options:
This selection displays a list of all the stations on the FDDI ring. Each entry on the list contains the station name, the station hexadecimal address, and the status of ports "A" and "B".
| Station | The station or alias name. |
| Address | The station's hexadecimal address. This address may be displayed in two formats: Ethernet or Token Ring. When the first 6 digits are 00 00 57, the Scitex address is in Ethernet format. When the digits are 00 00 EA, the Scitex address is in Token Ring format. The format is user selectable via the "Options" menu. (A non-Scitex station has different values.) |
| Stat. | Indicates the status of a port : THRU, WRAP, NOT CONNECTED (N.C.) or TWISTED. The name of the station connected to the port is also displayed. |
A screen is displayed with the statistics pertaining to a selected station.
In anyalyzing the network, it is sometimes useful to evaluate some of the following parameters:
| MAC_FRAME_CT | Number of frames which have arrived in the ring. |
| MAC_RECEIVE_CT | Number of frames this station has received. |
| MAC_TRANSMIT_CT | Number of frames this station has transmitted. |
| MAC_ERROR_CT | Number of incorrect frames for this station. |
| MAC_LOST_CT | Number of lost frames for this station. |
Under the "Utilities" option in the main menu, the following selections are available:
| Read SMT Attribute | This selection displays specific attribute information pertaining to the desired station. This utility is targeted for internal use since full understanding of the parameters requires the SMT software documentation. To exit, press the <ENTER> key three times. | ||||||||||
| Show local status | "Show
local status" displays the FDDI ring
connection status code for a particular station.
A normal status is 1001. All the possible codes
and their descriptions are:
|
||||||||||
| Open Log File | When
invoking SciRing Diagnostics, a log file named
"RING.LOG" is automatically opened.
Program I/O information is written to this file.
It is often useful to view this file when
diagnosing networking problems. Through the "Utilities" option, this log file may be Closed, Appended, Viewed or re-opened during the execution of SciRing. When choosing the "Open Log File" function, it implies that the "Close Log File" function has been previously invoked. When selecting "Open Log File", the log file "RING.LOG" is opened and new information is continuously logged. Any previously logged information has been erased from the "RING.LOG" file and saved to the "RING_LOG.OLD" file. |
||||||||||
| Close Log File | When choosing this selection, the active log file, "RING.LOG" is closed. The logging of I/O transactions is now suspended until the "Open Log File" or "Append Log File" option is invoked. | ||||||||||
| Append Log File | This selection allows the logging of I/O information to continue after having been aborted via the "Close Log File" option. The "RING.LOG" file has been re-opened and not erased. | ||||||||||
| View Log File | The user may view the low level I/O functions which have been tracked during the course of SciRing Diagnostics. The View function offers screen paging through the logged information by pressing the <SPACE> bar. |
"Q" returns to the SciRing Utilites Menu. For HELP on other useful commands available, press "H".
Under the "Options" selection in the main menu, the following selections are available:
| Auto Ring Update | When choosing the "Show Ring Diagram" selection, the ring diagram of the network is scanned and re-displayed every 60 seconds. Selecting "Auto Ring Update" allows the user to alter the timer or disable it completely. |
| Edit Station Aliases | This
selection assigns a given station a name. For a non-Scitex station, the name is displayed as "*****" alongside its address. For clarity, a name (maximum of 5 characters) may be assigned to this station. This procedure may also be performed to override a Scitex configured name. The file "RING.ALS" contains the information. Note, that this option actually calls the RMX editor. The user is required to enter the data in a special format using the editor commands. Here is a listing of the contents of "RING.ALS" before any aliases have been entered. It details through "Remark" statements exactly what format is required. This file contains address/station name conversions, primarily for non-Scitex stations on the ring. (Scitex station name conversion is done automatically, but may be overridden by this table.) Each entry contains the format flag, station address and station alias name as follows: Station address
format flag (left-most character): Station's address, in hex (6 bytes) where each byte is separated by a space and followed by Station name (up to five characters). Important: Each field is separated with a single space. A line with ';' at the beginning is considered as a comment line. Blank lines are skipped. At most, 256 alias entries may be defined. Example: Both lines above are equivalent, the first giving the address in Ethernet format and the second in token ring format |
| Set Address Display Format | When
choosing the "List RING Status" option
from the main menu, a station's hexadecimal
address is displayed. This address may be viewed in two formats: Ethernet or Token Ring. When the first 6 digits are 00 00 57, the Scitex address is in Ethernet format. When the digits are 00 00 EA, the Scitex address is in Token Ring format. (For non-Scitex stations, the values are different.) With this selection, the user can choose the address viewing format. The default is initially set to Ethernet format. |