Home | Contact Us | Submit Troubleshooting Info | Search | Help
Output | Software Solutions | Proofing | Color, Screening and Calibration | Scanning | Digital Photography | Consumables | POS
Home | Contact Us | Submit Troubleshooting Info | Search | Help
Output | Software Solutions | Proofing | Color, Screening and Calibration | Scanning | Digital Photography | Consumables | POS
Graphs | Interpretation | Data
This script measures the beam-pointing sensor readings as the laser current is incremented up to the nominal laser current setting.
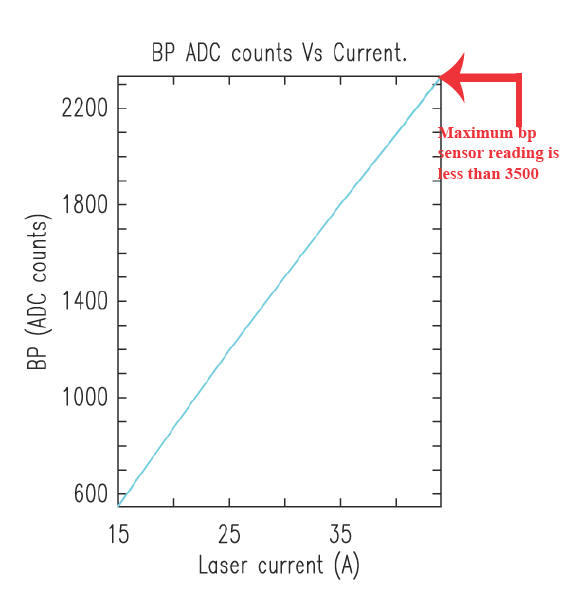
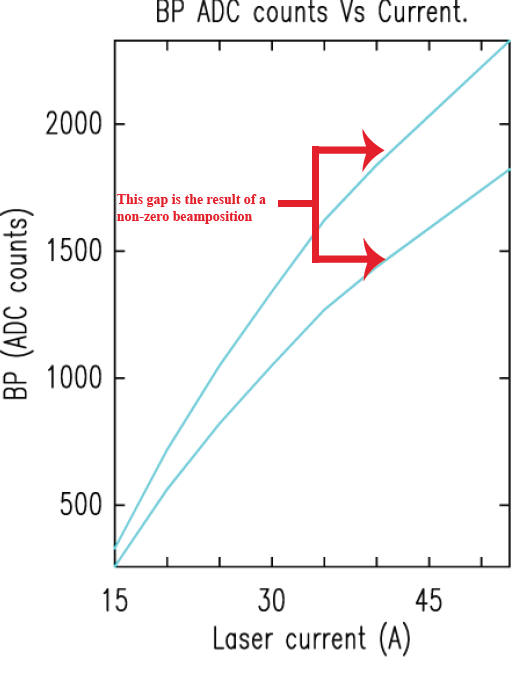
The graph BPMeasure.ps shows the BP readings versus laser current.
Check the graph for two things:
The graph contains data for each BP sensor, BP0 and BP1. If the BPD beamposition setting is zero, these lines should overlap. If the bp sensor reading at 15A is less than 60, then there could be problems with the sensor signal being too low. Also, if the maximum reading is above 3500, then there could be problems with the sensor signal being too high. Ensure that the sensor isn't saturating. See Note 6 .
There is one output file, BPMeasure_data.txt. This file contains nine data columns: